rabbit anti-α1 gaba a r polyclonal antibody Search Results


93
NeuroMab mouse anti α1 subunit antibody
Figure 1. GABRB-associated EE mutations. (A) Cryo-EM structure of the pentameric α1β2γ2 GABAA receptor (6X3X) viewed from the side and above, with the β subunits in red, the α subunits in blue, and the γ subunit in yellow. Arrows indicate the binding site (a) and the coupling zone (b). GABRB mutations are mapped onto the structure and represented as gray spheres. (B) Structural representation of deformation energies of the 6X3X structure. The magnitude of the deformation is represented by thin-to-thick tubes colored in blue (low), white (moderate), and red (high). Enlarged views of the deformation energies at the binding site (a-arrow) and the coupling zone (b-arrow) are shown in the lower panels. Structural domains part of the binding site and coupling zone are numbered and defined in panel (C). (C) The GABRB sequences with mapped missense mutations from this study are shown in bold red. The bold black color represents homologous missense mutations with different amino acid substitutions previously reported. Structural domains of the binding, coupling zone, and TMs are colored and described.
Mouse Anti α1 Subunit Antibody, supplied by NeuroMab, used in various techniques. Bioz Stars score: 93/100, based on 1 PubMed citations. ZERO BIAS - scores, article reviews, protocol conditions and more
https://www.bioz.com/product/rabbit+anti-%CE%B11+gaba+a+r+polyclonal+antibody/Anti-GABA-A-R%2C+Alpha1+Antibody/pm38136660-166-11-16
Average 93 stars, based on 1 article reviews
mouse anti α1 subunit antibody - by Bioz Stars, 2026-09
93/100 stars
  Buy from Supplier

92
Antibodies Inc anti-6xhis antibody
Figure 1. GABRB-associated EE mutations. (A) Cryo-EM structure of the pentameric α1β2γ2 GABAA receptor (6X3X) viewed from the side and above, with the β subunits in red, the α subunits in blue, and the γ subunit in yellow. Arrows indicate the binding site (a) and the coupling zone (b). GABRB mutations are mapped onto the structure and represented as gray spheres. (B) Structural representation of deformation energies of the 6X3X structure. The magnitude of the deformation is represented by thin-to-thick tubes colored in blue (low), white (moderate), and red (high). Enlarged views of the deformation energies at the binding site (a-arrow) and the coupling zone (b-arrow) are shown in the lower panels. Structural domains part of the binding site and coupling zone are numbered and defined in panel (C). (C) The GABRB sequences with mapped missense mutations from this study are shown in bold red. The bold black color represents homologous missense mutations with different amino acid substitutions previously reported. Structural domains of the binding, coupling zone, and TMs are colored and described.
Anti 6xhis Antibody, supplied by Antibodies Inc, used in various techniques. Bioz Stars score: 92/100, based on 1 PubMed citations. ZERO BIAS - scores, article reviews, protocol conditions and more
https://www.bioz.com/product/rabbit+anti-%CE%B11+gaba+a+r+polyclonal+antibody/Anti-6xHis+Antibody/custom%4075-169%4025193658
Average 92 stars, based on 1 article reviews
anti-6xhis antibody - by Bioz Stars, 2026-09
92/100 stars
  Buy from Supplier

93
Alomone Labs rabbit anti α5 gaba a r
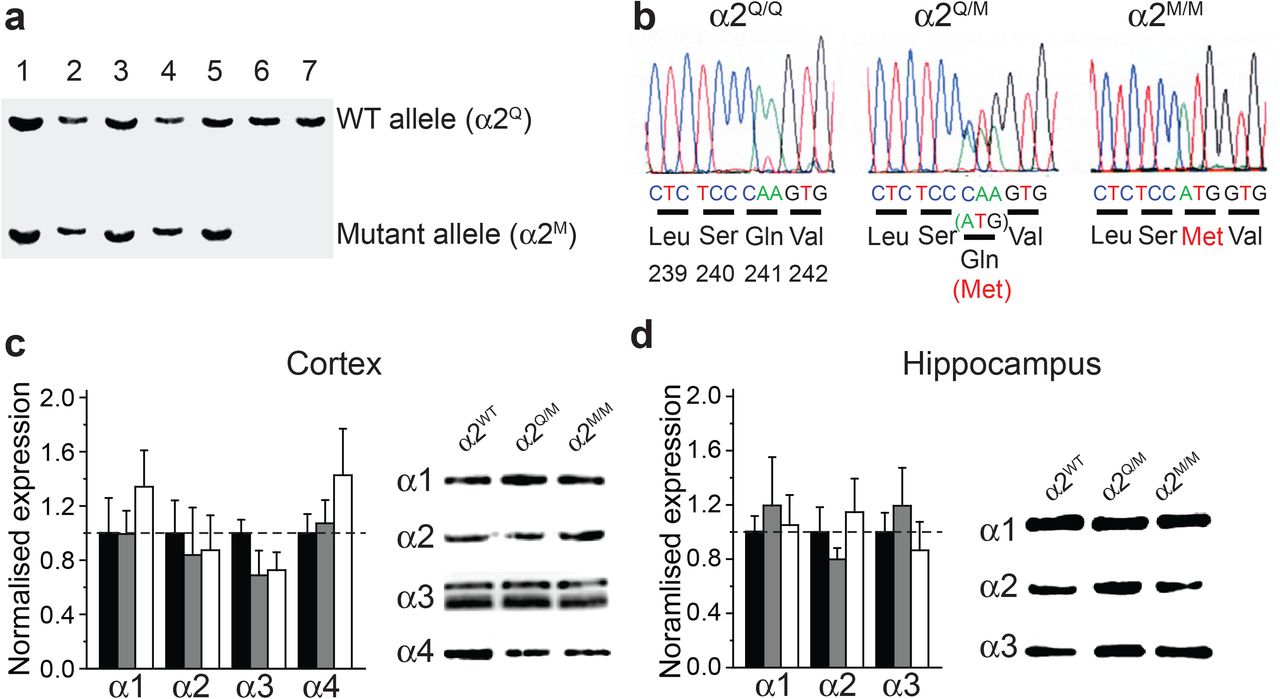
(a) Southern blot screen of ES cell lines: the Q241M mutation silently introduces a novel restriction site – allowing a screen for restriction fragment length polymorphism. Lanes 1 - 5, heterozygous recombinants; lanes 6 - 7, wild-type littermate controls. (b) Verifying the point mutation by DNA sequencing. Exon 8 was PCR-amplified from mouse genomic DNA of wild-type (α2 Q/Q : left), α2 Q/M (middle) and α2 M/M (right) animals, then sequenced. Sequence data around the point mutation are shown. (c,d) <t>GABA</t> <t>A</t> <t>R</t> α1-α4 subunit expression levels were determined by Western blotting total protein isolated from the cortex ( c ) and hippocampus ( d ). Left panels, quantitation of expression in α2 Q/M (grey) and α2 M/M (white) relative to wild-type (α2 Q/Q , black) brain samples. Right panels, representative Western blots from cortex and hippocampus for wild-type (WT), α2 Q/M and α2 M/M mice. Images show blots between 45 and 66 kDa markers. Loading controls with tubulin are omitted for clarity. Data are mean ± sem, one-way ANOVA, n = 6-9. There are no statistically significant differences between groups.
Rabbit Anti α5 Gaba A R, supplied by Alomone Labs, used in various techniques. Bioz Stars score: 93/100, based on 1 PubMed citations. ZERO BIAS - scores, article reviews, protocol conditions and more
https://www.bioz.com/product/rabbit+anti-%CE%B11+gaba+a+r+polyclonal+antibody/Anti-GABA(A)+alpha5+Receptor+Antibody/bio_rxiv__462457-177-41-32
Average 93 stars, based on 1 article reviews
rabbit anti α5 gaba a r - by Bioz Stars, 2026-09
93/100 stars
  Buy from Supplier

99
Cell Signaling Technology Inc anti β actin
(a) Southern blot screen of ES cell lines: the Q241M mutation silently introduces a novel restriction site – allowing a screen for restriction fragment length polymorphism. Lanes 1 - 5, heterozygous recombinants; lanes 6 - 7, wild-type littermate controls. (b) Verifying the point mutation by DNA sequencing. Exon 8 was PCR-amplified from mouse genomic DNA of wild-type (α2 Q/Q : left), α2 Q/M (middle) and α2 M/M (right) animals, then sequenced. Sequence data around the point mutation are shown. (c,d) <t>GABA</t> <t>A</t> <t>R</t> α1-α4 subunit expression levels were determined by Western blotting total protein isolated from the cortex ( c ) and hippocampus ( d ). Left panels, quantitation of expression in α2 Q/M (grey) and α2 M/M (white) relative to wild-type (α2 Q/Q , black) brain samples. Right panels, representative Western blots from cortex and hippocampus for wild-type (WT), α2 Q/M and α2 M/M mice. Images show blots between 45 and 66 kDa markers. Loading controls with tubulin are omitted for clarity. Data are mean ± sem, one-way ANOVA, n = 6-9. There are no statistically significant differences between groups.
Anti β Actin, supplied by Cell Signaling Technology Inc, used in various techniques. Bioz Stars score: 99/100, based on 1 PubMed citations. ZERO BIAS - scores, article reviews, protocol conditions and more
https://www.bioz.com/product/rabbit+anti-%CE%B11+gaba+a+r+polyclonal+antibody/beta-Actin+Antibody/pmc06618922-61-32-34
Average 99 stars, based on 1 article reviews
anti β actin - by Bioz Stars, 2026-09
99/100 stars
  Buy from Supplier

94
Alomone Labs anti-gaba γ2 receptor antibody
(a) Southern blot screen of ES cell lines: the Q241M mutation silently introduces a novel restriction site – allowing a screen for restriction fragment length polymorphism. Lanes 1 - 5, heterozygous recombinants; lanes 6 - 7, wild-type littermate controls. (b) Verifying the point mutation by DNA sequencing. Exon 8 was PCR-amplified from mouse genomic DNA of wild-type (α2 Q/Q : left), α2 Q/M (middle) and α2 M/M (right) animals, then sequenced. Sequence data around the point mutation are shown. (c,d) <t>GABA</t> <t>A</t> <t>R</t> α1-α4 subunit expression levels were determined by Western blotting total protein isolated from the cortex ( c ) and hippocampus ( d ). Left panels, quantitation of expression in α2 Q/M (grey) and α2 M/M (white) relative to wild-type (α2 Q/Q , black) brain samples. Right panels, representative Western blots from cortex and hippocampus for wild-type (WT), α2 Q/M and α2 M/M mice. Images show blots between 45 and 66 kDa markers. Loading controls with tubulin are omitted for clarity. Data are mean ± sem, one-way ANOVA, n = 6-9. There are no statistically significant differences between groups.
Anti Gaba γ2 Receptor Antibody, supplied by Alomone Labs, used in various techniques. Bioz Stars score: 94/100, based on 1 PubMed citations. ZERO BIAS - scores, article reviews, protocol conditions and more
https://www.bioz.com/product/rabbit+anti-%CE%B11+gaba+a+r+polyclonal+antibody/Anti-GABA+%CE%B32+Receptor+Antibody/alomone+labs___aga-005
Average 94 stars, based on 1 article reviews
anti-gaba γ2 receptor antibody - by Bioz Stars, 2026-09
94/100 stars
  Buy from Supplier

96
PhosphoSolutions rabbit anti β2 subunit
(a) Southern blot screen of ES cell lines: the Q241M mutation silently introduces a novel restriction site – allowing a screen for restriction fragment length polymorphism. Lanes 1 - 5, heterozygous recombinants; lanes 6 - 7, wild-type littermate controls. (b) Verifying the point mutation by DNA sequencing. Exon 8 was PCR-amplified from mouse genomic DNA of wild-type (α2 Q/Q : left), α2 Q/M (middle) and α2 M/M (right) animals, then sequenced. Sequence data around the point mutation are shown. (c,d) <t>GABA</t> <t>A</t> <t>R</t> α1-α4 subunit expression levels were determined by Western blotting total protein isolated from the cortex ( c ) and hippocampus ( d ). Left panels, quantitation of expression in α2 Q/M (grey) and α2 M/M (white) relative to wild-type (α2 Q/Q , black) brain samples. Right panels, representative Western blots from cortex and hippocampus for wild-type (WT), α2 Q/M and α2 M/M mice. Images show blots between 45 and 66 kDa markers. Loading controls with tubulin are omitted for clarity. Data are mean ± sem, one-way ANOVA, n = 6-9. There are no statistically significant differences between groups.
Rabbit Anti β2 Subunit, supplied by PhosphoSolutions, used in various techniques. Bioz Stars score: 96/100, based on 1 PubMed citations. ZERO BIAS - scores, article reviews, protocol conditions and more
https://www.bioz.com/product/rabbit+anti-%CE%B11+gaba+a+r+polyclonal+antibody/Anti-GABAA+Receptor+%C3%9F2+Antibody/bio_rxiv__2023__12__04__569994-201-80-84
Average 96 stars, based on 1 article reviews
rabbit anti β2 subunit - by Bioz Stars, 2026-09
96/100 stars
  Buy from Supplier

90
Aviva Systems anti α5 gabaa receptor subunit
(a) Southern blot screen of ES cell lines: the Q241M mutation silently introduces a novel restriction site – allowing a screen for restriction fragment length polymorphism. Lanes 1 - 5, heterozygous recombinants; lanes 6 - 7, wild-type littermate controls. (b) Verifying the point mutation by DNA sequencing. Exon 8 was PCR-amplified from mouse genomic DNA of wild-type (α2 Q/Q : left), α2 Q/M (middle) and α2 M/M (right) animals, then sequenced. Sequence data around the point mutation are shown. (c,d) <t>GABA</t> <t>A</t> <t>R</t> α1-α4 subunit expression levels were determined by Western blotting total protein isolated from the cortex ( c ) and hippocampus ( d ). Left panels, quantitation of expression in α2 Q/M (grey) and α2 M/M (white) relative to wild-type (α2 Q/Q , black) brain samples. Right panels, representative Western blots from cortex and hippocampus for wild-type (WT), α2 Q/M and α2 M/M mice. Images show blots between 45 and 66 kDa markers. Loading controls with tubulin are omitted for clarity. Data are mean ± sem, one-way ANOVA, n = 6-9. There are no statistically significant differences between groups.
Anti α5 Gabaa Receptor Subunit, supplied by Aviva Systems, used in various techniques. Bioz Stars score: 90/100, based on 1 PubMed citations. ZERO BIAS - scores, article reviews, protocol conditions and more
https://www.bioz.com/product/rabbit+anti-%CE%B11+gaba+a+r+polyclonal+antibody/GABRA5+Peptide+-+middle+region+(AAP34984)/pm36163283-527-11-16
Average 90 stars, based on 1 article reviews
anti α5 gabaa receptor subunit - by Bioz Stars, 2026-09
90/100 stars
  Buy from Supplier

92
NeuroMab mab anti his tag
(a) Southern blot screen of ES cell lines: the Q241M mutation silently introduces a novel restriction site – allowing a screen for restriction fragment length polymorphism. Lanes 1 - 5, heterozygous recombinants; lanes 6 - 7, wild-type littermate controls. (b) Verifying the point mutation by DNA sequencing. Exon 8 was PCR-amplified from mouse genomic DNA of wild-type (α2 Q/Q : left), α2 Q/M (middle) and α2 M/M (right) animals, then sequenced. Sequence data around the point mutation are shown. (c,d) <t>GABA</t> <t>A</t> <t>R</t> α1-α4 subunit expression levels were determined by Western blotting total protein isolated from the cortex ( c ) and hippocampus ( d ). Left panels, quantitation of expression in α2 Q/M (grey) and α2 M/M (white) relative to wild-type (α2 Q/Q , black) brain samples. Right panels, representative Western blots from cortex and hippocampus for wild-type (WT), α2 Q/M and α2 M/M mice. Images show blots between 45 and 66 kDa markers. Loading controls with tubulin are omitted for clarity. Data are mean ± sem, one-way ANOVA, n = 6-9. There are no statistically significant differences between groups.
Mab Anti His Tag, supplied by NeuroMab, used in various techniques. Bioz Stars score: 92/100, based on 1 PubMed citations. ZERO BIAS - scores, article reviews, protocol conditions and more
https://www.bioz.com/product/rabbit+anti-%CE%B11+gaba+a+r+polyclonal+antibody/Anti-6xHis+Antibody/pmc04200290-63-2-25
Average 92 stars, based on 1 article reviews
mab anti his tag - by Bioz Stars, 2026-09
92/100 stars
  Buy from Supplier

95
Cell Signaling Technology Inc rabbit anti nr2a polyclonal antibody
Western blotting analysis of the three NMDAR subunits, NR1, <t>NR2A,</t> and NR2B in WT and KO dorsal (A) and ventral hippocampus (B) . The results of the statistical analysis (independent t -test) showed similar expressions between the WT and KO dorsal hippocampus (NR1: t 14 = 0.107, p = 0.813; NR2A: t 14 = –0.24, p = 0.369; NR2B: t 14 = 1.128, p = 0.842; n = 8 rats in either genotype), and ventral hippocampus (NR1: t 14 = –0.241, p = 0.813; NR2A: t 14 = 0.803, p = 0.435; NR2B: t 14 = 0.203, p = 0.842; n = 8 rats in either genotype). Also, the NR2A/NR2B ratio is similar in WT and KO dorsal ( t 10.15 = –1.38, p = 0.199) and ventral hippocampus ( t 9.72 = 0.383, p = 0.71). The expression of NR2A subunit and the NR2A/NR2B ratio is higher in the dorsal compared with the ventral hippocampus in both WT (NR2A: t 14 = 4.27, p < 0.001, and NR2A/NR2B ratio: t 14 = 3.08, p = 0.008) and KO rats (NR2A: t 14 = 4.017, p = 0.001, and NR2A/NR2B ratio: t 14 = 3.01, p = 0.009). In contrast, NR1 and NR2B are similarly expressed in WT and KO dorsal (NR1: t 14 = 1.308, p = 0.212, and NR2B: t 14 = 1.09, p = 0.294) and ventral hippocampus (NR1: t 14 = 1.039, p = 0.316, and NR2B: t 14 = 0.187, p = 0.854). (C) Images of individual western blot samples with detected bands of the NMDA receptor protein subunits, and the corresponding loading marker band of beta actin. “ns” denotes not significant difference.
Rabbit Anti Nr2a Polyclonal Antibody, supplied by Cell Signaling Technology Inc, used in various techniques. Bioz Stars score: 95/100, based on 1 PubMed citations. ZERO BIAS - scores, article reviews, protocol conditions and more
https://www.bioz.com/product/rabbit+anti-%CE%B11+gaba+a+r+polyclonal+antibody/NMDA+Receptor+2A+(GluN2A)+Antibody/pmc10722241-162-35-41
Average 95 stars, based on 1 article reviews
rabbit anti nr2a polyclonal antibody - by Bioz Stars, 2026-09
95/100 stars
  Buy from Supplier

95
Cell Signaling Technology Inc rabbit anti nr1 monoclonal antibody
Western blotting analysis of the three NMDAR subunits, <t>NR1,</t> NR2A, and NR2B in WT and KO dorsal (A) and ventral hippocampus (B) . The results of the statistical analysis (independent t -test) showed similar expressions between the WT and KO dorsal hippocampus (NR1: t 14 = 0.107, p = 0.813; NR2A: t 14 = –0.24, p = 0.369; NR2B: t 14 = 1.128, p = 0.842; n = 8 rats in either genotype), and ventral hippocampus (NR1: t 14 = –0.241, p = 0.813; NR2A: t 14 = 0.803, p = 0.435; NR2B: t 14 = 0.203, p = 0.842; n = 8 rats in either genotype). Also, the NR2A/NR2B ratio is similar in WT and KO dorsal ( t 10.15 = –1.38, p = 0.199) and ventral hippocampus ( t 9.72 = 0.383, p = 0.71). The expression of NR2A subunit and the NR2A/NR2B ratio is higher in the dorsal compared with the ventral hippocampus in both WT (NR2A: t 14 = 4.27, p < 0.001, and NR2A/NR2B ratio: t 14 = 3.08, p = 0.008) and KO rats (NR2A: t 14 = 4.017, p = 0.001, and NR2A/NR2B ratio: t 14 = 3.01, p = 0.009). In contrast, NR1 and NR2B are similarly expressed in WT and KO dorsal (NR1: t 14 = 1.308, p = 0.212, and NR2B: t 14 = 1.09, p = 0.294) and ventral hippocampus (NR1: t 14 = 1.039, p = 0.316, and NR2B: t 14 = 0.187, p = 0.854). (C) Images of individual western blot samples with detected bands of the NMDA receptor protein subunits, and the corresponding loading marker band of beta actin. “ns” denotes not significant difference.
Rabbit Anti Nr1 Monoclonal Antibody, supplied by Cell Signaling Technology Inc, used in various techniques. Bioz Stars score: 95/100, based on 1 PubMed citations. ZERO BIAS - scores, article reviews, protocol conditions and more
https://www.bioz.com/product/rabbit+anti-%CE%B11+gaba+a+r+polyclonal+antibody/NMDA+Receptor+1+(GluN1)+Rabbit+mAb/pmc10722241-162-27-33
Average 95 stars, based on 1 article reviews
rabbit anti nr1 monoclonal antibody - by Bioz Stars, 2026-09
95/100 stars
  Buy from Supplier

93
Proteintech primary antibodies against α1
Male APP NLGF mice exhibit greater sensitivity to diazepam-induced impairment of locomotor activity than female APP NLGF and wildtype (WT) mice in the open field test. Both male and female APP NLGF mice show significantly higher basal locomotor activity than their WT counterparts. While only 3 mg/kg of diazepam elicited significant suppression of locomotor activity in WT mice, <t>1</t> mg/kg of diazepam significantly suppressed locomotor activity in male and female APP NLGF mice, whereas only male APP NLGF mice were showed significant suppression of locomotor activity at 0.2 mg/kg of diazepam, suggesting that the male APP NLGF mice are more sensitivity to diazepam-induced impairment of locomotor activity than female APP NLGF and WT mice. Data represent mean ± SEM of 7 mice per group. ***p < 0.001 when compared to respective vehicle-treated male and female WT mice, # p < 0.05 and ### p < 0.001 when compared to respective vehicle-treated male and female APP NLGF mice, ∧ p < 0.05 when compared to diazepam-treated male APP NLGF mice. Three-way ANOVA followed by Tukey's post hoc analysis.
Primary Antibodies Against α1, supplied by Proteintech, used in various techniques. Bioz Stars score: 93/100, based on 1 PubMed citations. ZERO BIAS - scores, article reviews, protocol conditions and more
https://www.bioz.com/product/rabbit+anti-%CE%B11+gaba+a+r+polyclonal+antibody/GABRA1+Antibody/pmc09743067-90-16-22
Average 93 stars, based on 1 article reviews
primary antibodies against α1 - by Bioz Stars, 2026-09
93/100 stars
  Buy from Supplier

96
PhosphoSolutions rabbit anti δ gaba a receptor subunit
Male APP NLGF mice exhibit greater sensitivity to diazepam-induced impairment of locomotor activity than female APP NLGF and wildtype (WT) mice in the open field test. Both male and female APP NLGF mice show significantly higher basal locomotor activity than their WT counterparts. While only 3 mg/kg of diazepam elicited significant suppression of locomotor activity in WT mice, <t>1</t> mg/kg of diazepam significantly suppressed locomotor activity in male and female APP NLGF mice, whereas only male APP NLGF mice were showed significant suppression of locomotor activity at 0.2 mg/kg of diazepam, suggesting that the male APP NLGF mice are more sensitivity to diazepam-induced impairment of locomotor activity than female APP NLGF and WT mice. Data represent mean ± SEM of 7 mice per group. ***p < 0.001 when compared to respective vehicle-treated male and female WT mice, # p < 0.05 and ### p < 0.001 when compared to respective vehicle-treated male and female APP NLGF mice, ∧ p < 0.05 when compared to diazepam-treated male APP NLGF mice. Three-way ANOVA followed by Tukey's post hoc analysis.
Rabbit Anti δ Gaba A Receptor Subunit, supplied by PhosphoSolutions, used in various techniques. Bioz Stars score: 96/100, based on 1 PubMed citations. ZERO BIAS - scores, article reviews, protocol conditions and more
https://www.bioz.com/product/rabbit+anti-%CE%B11+gaba+a+r+polyclonal+antibody/Anti-GABAA+Receptor+%CE%B11%2C+N-Terminus+Antibody/pmc07059189-50-18-27
Average 96 stars, based on 1 article reviews
rabbit anti δ gaba a receptor subunit - by Bioz Stars, 2026-09
96/100 stars
  Buy from Supplier

Image Search Results


Figure 1. GABRB-associated EE mutations. (A) Cryo-EM structure of the pentameric α1β2γ2 GABAA receptor (6X3X) viewed from the side and above, with the β subunits in red, the α subunits in blue, and the γ subunit in yellow. Arrows indicate the binding site (a) and the coupling zone (b). GABRB mutations are mapped onto the structure and represented as gray spheres. (B) Structural representation of deformation energies of the 6X3X structure. The magnitude of the deformation is represented by thin-to-thick tubes colored in blue (low), white (moderate), and red (high). Enlarged views of the deformation energies at the binding site (a-arrow) and the coupling zone (b-arrow) are shown in the lower panels. Structural domains part of the binding site and coupling zone are numbered and defined in panel (C). (C) The GABRB sequences with mapped missense mutations from this study are shown in bold red. The bold black color represents homologous missense mutations with different amino acid substitutions previously reported. Structural domains of the binding, coupling zone, and TMs are colored and described.

Journal: Biomolecules

Article Title: Epileptic Encephalopathy GABRB Structural Variants Share Common Gating and Trafficking Defects.

doi: 10.3390/biom13121790

Figure Lengend Snippet: Figure 1. GABRB-associated EE mutations. (A) Cryo-EM structure of the pentameric α1β2γ2 GABAA receptor (6X3X) viewed from the side and above, with the β subunits in red, the α subunits in blue, and the γ subunit in yellow. Arrows indicate the binding site (a) and the coupling zone (b). GABRB mutations are mapped onto the structure and represented as gray spheres. (B) Structural representation of deformation energies of the 6X3X structure. The magnitude of the deformation is represented by thin-to-thick tubes colored in blue (low), white (moderate), and red (high). Enlarged views of the deformation energies at the binding site (a-arrow) and the coupling zone (b-arrow) are shown in the lower panels. Structural domains part of the binding site and coupling zone are numbered and defined in panel (C). (C) The GABRB sequences with mapped missense mutations from this study are shown in bold red. The bold black color represents homologous missense mutations with different amino acid substitutions previously reported. Structural domains of the binding, coupling zone, and TMs are colored and described.

Article Snippet: The primary antibodies used to detect GABAA receptors were as follows: mouse anti-α1 subunit antibody (1:500; NeuroMab, 75-136, Davis, CA, USA), rabbit anti-β3 subunit antibody (1:500; Novus, NB300199, St. Louis, MO, USA), rabbit anti-β2 subunit antibody (1:1000; Millipore, AB5561, Burlington, MA, USA), and rabbit anti-γ2 subunit antibody (1:1000; Millipore, AB5559).

Techniques: Cryo-EM Sample Prep, Binding Assay

Figure 5. GABRB3 mutations altered the flexibility and function of GABAA receptors. (A) Structural representation of the GABAA receptor flexible conformation based on the vibrational entropy energy change (∆∆SVib ENCoM) predicted between the wild-type and the mutant β3 subunit in the 6HUP structure. Mutant β3 subunits are colored according to the vibrational entropy perturbation upon mutation. Shades of blue represent a loss of flexibility (rigidification of the structure), and shades of red mean an increase in structural flexibility. ∆∆SVib ENCoM values are shown at the bottom of the corresponding mutation. In brackets, the variants are numbered based on the 6HUP structure. (B) In the upper panel, concentration–response curves of wild-type and mutant α1β3γ2 receptors are shown. GABA-evoked currents were normalized to the maximal response to 1 mM GABA. Lower panel, Pearson correlation coefficients obtained from the ∆∆G of the mutant β3 structures were plotted against surface (left graph) and total (right graph) expression levels of α1, β3, and γ2 subunits according to the data displayed in panels (C,D), respectively. Lines represent linear regression fits. (C,D) Surface and total expression levels of wild-type and mutant β3 subunits coexpressed with α1 and γ2 subunits, respectively.

Journal: Biomolecules

Article Title: Epileptic Encephalopathy GABRB Structural Variants Share Common Gating and Trafficking Defects.

doi: 10.3390/biom13121790

Figure Lengend Snippet: Figure 5. GABRB3 mutations altered the flexibility and function of GABAA receptors. (A) Structural representation of the GABAA receptor flexible conformation based on the vibrational entropy energy change (∆∆SVib ENCoM) predicted between the wild-type and the mutant β3 subunit in the 6HUP structure. Mutant β3 subunits are colored according to the vibrational entropy perturbation upon mutation. Shades of blue represent a loss of flexibility (rigidification of the structure), and shades of red mean an increase in structural flexibility. ∆∆SVib ENCoM values are shown at the bottom of the corresponding mutation. In brackets, the variants are numbered based on the 6HUP structure. (B) In the upper panel, concentration–response curves of wild-type and mutant α1β3γ2 receptors are shown. GABA-evoked currents were normalized to the maximal response to 1 mM GABA. Lower panel, Pearson correlation coefficients obtained from the ∆∆G of the mutant β3 structures were plotted against surface (left graph) and total (right graph) expression levels of α1, β3, and γ2 subunits according to the data displayed in panels (C,D), respectively. Lines represent linear regression fits. (C,D) Surface and total expression levels of wild-type and mutant β3 subunits coexpressed with α1 and γ2 subunits, respectively.

Article Snippet: The primary antibodies used to detect GABAA receptors were as follows: mouse anti-α1 subunit antibody (1:500; NeuroMab, 75-136, Davis, CA, USA), rabbit anti-β3 subunit antibody (1:500; Novus, NB300199, St. Louis, MO, USA), rabbit anti-β2 subunit antibody (1:1000; Millipore, AB5561, Burlington, MA, USA), and rabbit anti-γ2 subunit antibody (1:1000; Millipore, AB5559).

Techniques: Mutagenesis, Concentration Assay, Expressing

(a) Southern blot screen of ES cell lines: the Q241M mutation silently introduces a novel restriction site – allowing a screen for restriction fragment length polymorphism. Lanes 1 - 5, heterozygous recombinants; lanes 6 - 7, wild-type littermate controls. (b) Verifying the point mutation by DNA sequencing. Exon 8 was PCR-amplified from mouse genomic DNA of wild-type (α2 Q/Q : left), α2 Q/M (middle) and α2 M/M (right) animals, then sequenced. Sequence data around the point mutation are shown. (c,d) GABA A R α1-α4 subunit expression levels were determined by Western blotting total protein isolated from the cortex ( c ) and hippocampus ( d ). Left panels, quantitation of expression in α2 Q/M (grey) and α2 M/M (white) relative to wild-type (α2 Q/Q , black) brain samples. Right panels, representative Western blots from cortex and hippocampus for wild-type (WT), α2 Q/M and α2 M/M mice. Images show blots between 45 and 66 kDa markers. Loading controls with tubulin are omitted for clarity. Data are mean ± sem, one-way ANOVA, n = 6-9. There are no statistically significant differences between groups.

Journal: bioRxiv

Article Title: Brain neurosteroids are natural anxiolytics targeting α2 subunit γ-aminobutyric acid type-A receptors

doi: 10.1101/462457

Figure Lengend Snippet: (a) Southern blot screen of ES cell lines: the Q241M mutation silently introduces a novel restriction site – allowing a screen for restriction fragment length polymorphism. Lanes 1 - 5, heterozygous recombinants; lanes 6 - 7, wild-type littermate controls. (b) Verifying the point mutation by DNA sequencing. Exon 8 was PCR-amplified from mouse genomic DNA of wild-type (α2 Q/Q : left), α2 Q/M (middle) and α2 M/M (right) animals, then sequenced. Sequence data around the point mutation are shown. (c,d) GABA A R α1-α4 subunit expression levels were determined by Western blotting total protein isolated from the cortex ( c ) and hippocampus ( d ). Left panels, quantitation of expression in α2 Q/M (grey) and α2 M/M (white) relative to wild-type (α2 Q/Q , black) brain samples. Right panels, representative Western blots from cortex and hippocampus for wild-type (WT), α2 Q/M and α2 M/M mice. Images show blots between 45 and 66 kDa markers. Loading controls with tubulin are omitted for clarity. Data are mean ± sem, one-way ANOVA, n = 6-9. There are no statistically significant differences between groups.

Article Snippet: For immunohistochemistry, the following primary antibodies were used: rabbit anti-α1-GABA A R (1:20000, from Jean-Marc Fritschy, University of Zurich), guinea-pig anti-α2-GABA A R (1:1000, from Jean-Marc Fritschy), rabbit anti-α3-GABA A R (1:1000, Alomone Labs), rabbit anti-α4-GABA A R (1:500, Werner Sieghart), rabbit anti-α5-GABA A R (1:500, Werner Sieghart).

Techniques: Southern Blot, Mutagenesis, DNA Sequencing, Amplification, Sequencing, Expressing, Western Blot, Isolation, Quantitation Assay

Western blotting analysis of the three NMDAR subunits, NR1, NR2A, and NR2B in WT and KO dorsal (A) and ventral hippocampus (B) . The results of the statistical analysis (independent t -test) showed similar expressions between the WT and KO dorsal hippocampus (NR1: t 14 = 0.107, p = 0.813; NR2A: t 14 = –0.24, p = 0.369; NR2B: t 14 = 1.128, p = 0.842; n = 8 rats in either genotype), and ventral hippocampus (NR1: t 14 = –0.241, p = 0.813; NR2A: t 14 = 0.803, p = 0.435; NR2B: t 14 = 0.203, p = 0.842; n = 8 rats in either genotype). Also, the NR2A/NR2B ratio is similar in WT and KO dorsal ( t 10.15 = –1.38, p = 0.199) and ventral hippocampus ( t 9.72 = 0.383, p = 0.71). The expression of NR2A subunit and the NR2A/NR2B ratio is higher in the dorsal compared with the ventral hippocampus in both WT (NR2A: t 14 = 4.27, p < 0.001, and NR2A/NR2B ratio: t 14 = 3.08, p = 0.008) and KO rats (NR2A: t 14 = 4.017, p = 0.001, and NR2A/NR2B ratio: t 14 = 3.01, p = 0.009). In contrast, NR1 and NR2B are similarly expressed in WT and KO dorsal (NR1: t 14 = 1.308, p = 0.212, and NR2B: t 14 = 1.09, p = 0.294) and ventral hippocampus (NR1: t 14 = 1.039, p = 0.316, and NR2B: t 14 = 0.187, p = 0.854). (C) Images of individual western blot samples with detected bands of the NMDA receptor protein subunits, and the corresponding loading marker band of beta actin. “ns” denotes not significant difference.

Journal: Frontiers in Cellular Neuroscience

Article Title: Rescue of sharp wave-ripples and prevention of network hyperexcitability in the ventral but not the dorsal hippocampus of a rat model of fragile X syndrome

doi: 10.3389/fncel.2023.1296235

Figure Lengend Snippet: Western blotting analysis of the three NMDAR subunits, NR1, NR2A, and NR2B in WT and KO dorsal (A) and ventral hippocampus (B) . The results of the statistical analysis (independent t -test) showed similar expressions between the WT and KO dorsal hippocampus (NR1: t 14 = 0.107, p = 0.813; NR2A: t 14 = –0.24, p = 0.369; NR2B: t 14 = 1.128, p = 0.842; n = 8 rats in either genotype), and ventral hippocampus (NR1: t 14 = –0.241, p = 0.813; NR2A: t 14 = 0.803, p = 0.435; NR2B: t 14 = 0.203, p = 0.842; n = 8 rats in either genotype). Also, the NR2A/NR2B ratio is similar in WT and KO dorsal ( t 10.15 = –1.38, p = 0.199) and ventral hippocampus ( t 9.72 = 0.383, p = 0.71). The expression of NR2A subunit and the NR2A/NR2B ratio is higher in the dorsal compared with the ventral hippocampus in both WT (NR2A: t 14 = 4.27, p < 0.001, and NR2A/NR2B ratio: t 14 = 3.08, p = 0.008) and KO rats (NR2A: t 14 = 4.017, p = 0.001, and NR2A/NR2B ratio: t 14 = 3.01, p = 0.009). In contrast, NR1 and NR2B are similarly expressed in WT and KO dorsal (NR1: t 14 = 1.308, p = 0.212, and NR2B: t 14 = 1.09, p = 0.294) and ventral hippocampus (NR1: t 14 = 1.039, p = 0.316, and NR2B: t 14 = 0.187, p = 0.854). (C) Images of individual western blot samples with detected bands of the NMDA receptor protein subunits, and the corresponding loading marker band of beta actin. “ns” denotes not significant difference.

Article Snippet: Membranes were next incubated overnight at 4°C with the following primary antibodies diluted in 3% PBST: rabbit anti-α1 GABA A R polyclonal antibody (1:2500 #06-868, Millipore Sigma), rabbit anti-NR1 monoclonal antibody (1:1000 #D65B7, Cell Signaling), rabbit anti-NR2A polyclonal antibody (1:1000 #4205, Cell Signaling), rabbit anti-NR2B monoclonal antibody (1:1000 #B8E10, Cell Signaling) and rabbit anti-β-actin polyclonal antibody (1:15000 #E-AB-20058, Elabscience).

Techniques: Western Blot, Expressing, Marker

Western blotting analysis of the three NMDAR subunits, NR1, NR2A, and NR2B in WT and KO dorsal (A) and ventral hippocampus (B) . The results of the statistical analysis (independent t -test) showed similar expressions between the WT and KO dorsal hippocampus (NR1: t 14 = 0.107, p = 0.813; NR2A: t 14 = –0.24, p = 0.369; NR2B: t 14 = 1.128, p = 0.842; n = 8 rats in either genotype), and ventral hippocampus (NR1: t 14 = –0.241, p = 0.813; NR2A: t 14 = 0.803, p = 0.435; NR2B: t 14 = 0.203, p = 0.842; n = 8 rats in either genotype). Also, the NR2A/NR2B ratio is similar in WT and KO dorsal ( t 10.15 = –1.38, p = 0.199) and ventral hippocampus ( t 9.72 = 0.383, p = 0.71). The expression of NR2A subunit and the NR2A/NR2B ratio is higher in the dorsal compared with the ventral hippocampus in both WT (NR2A: t 14 = 4.27, p < 0.001, and NR2A/NR2B ratio: t 14 = 3.08, p = 0.008) and KO rats (NR2A: t 14 = 4.017, p = 0.001, and NR2A/NR2B ratio: t 14 = 3.01, p = 0.009). In contrast, NR1 and NR2B are similarly expressed in WT and KO dorsal (NR1: t 14 = 1.308, p = 0.212, and NR2B: t 14 = 1.09, p = 0.294) and ventral hippocampus (NR1: t 14 = 1.039, p = 0.316, and NR2B: t 14 = 0.187, p = 0.854). (C) Images of individual western blot samples with detected bands of the NMDA receptor protein subunits, and the corresponding loading marker band of beta actin. “ns” denotes not significant difference.

Journal: Frontiers in Cellular Neuroscience

Article Title: Rescue of sharp wave-ripples and prevention of network hyperexcitability in the ventral but not the dorsal hippocampus of a rat model of fragile X syndrome

doi: 10.3389/fncel.2023.1296235

Figure Lengend Snippet: Western blotting analysis of the three NMDAR subunits, NR1, NR2A, and NR2B in WT and KO dorsal (A) and ventral hippocampus (B) . The results of the statistical analysis (independent t -test) showed similar expressions between the WT and KO dorsal hippocampus (NR1: t 14 = 0.107, p = 0.813; NR2A: t 14 = –0.24, p = 0.369; NR2B: t 14 = 1.128, p = 0.842; n = 8 rats in either genotype), and ventral hippocampus (NR1: t 14 = –0.241, p = 0.813; NR2A: t 14 = 0.803, p = 0.435; NR2B: t 14 = 0.203, p = 0.842; n = 8 rats in either genotype). Also, the NR2A/NR2B ratio is similar in WT and KO dorsal ( t 10.15 = –1.38, p = 0.199) and ventral hippocampus ( t 9.72 = 0.383, p = 0.71). The expression of NR2A subunit and the NR2A/NR2B ratio is higher in the dorsal compared with the ventral hippocampus in both WT (NR2A: t 14 = 4.27, p < 0.001, and NR2A/NR2B ratio: t 14 = 3.08, p = 0.008) and KO rats (NR2A: t 14 = 4.017, p = 0.001, and NR2A/NR2B ratio: t 14 = 3.01, p = 0.009). In contrast, NR1 and NR2B are similarly expressed in WT and KO dorsal (NR1: t 14 = 1.308, p = 0.212, and NR2B: t 14 = 1.09, p = 0.294) and ventral hippocampus (NR1: t 14 = 1.039, p = 0.316, and NR2B: t 14 = 0.187, p = 0.854). (C) Images of individual western blot samples with detected bands of the NMDA receptor protein subunits, and the corresponding loading marker band of beta actin. “ns” denotes not significant difference.

Article Snippet: Membranes were next incubated overnight at 4°C with the following primary antibodies diluted in 3% PBST: rabbit anti-α1 GABA A R polyclonal antibody (1:2500 #06-868, Millipore Sigma), rabbit anti-NR1 monoclonal antibody (1:1000 #D65B7, Cell Signaling), rabbit anti-NR2A polyclonal antibody (1:1000 #4205, Cell Signaling), rabbit anti-NR2B monoclonal antibody (1:1000 #B8E10, Cell Signaling) and rabbit anti-β-actin polyclonal antibody (1:15000 #E-AB-20058, Elabscience).

Techniques: Western Blot, Expressing, Marker

Male APP NLGF mice exhibit greater sensitivity to diazepam-induced impairment of locomotor activity than female APP NLGF and wildtype (WT) mice in the open field test. Both male and female APP NLGF mice show significantly higher basal locomotor activity than their WT counterparts. While only 3 mg/kg of diazepam elicited significant suppression of locomotor activity in WT mice, 1 mg/kg of diazepam significantly suppressed locomotor activity in male and female APP NLGF mice, whereas only male APP NLGF mice were showed significant suppression of locomotor activity at 0.2 mg/kg of diazepam, suggesting that the male APP NLGF mice are more sensitivity to diazepam-induced impairment of locomotor activity than female APP NLGF and WT mice. Data represent mean ± SEM of 7 mice per group. ***p < 0.001 when compared to respective vehicle-treated male and female WT mice, # p < 0.05 and ### p < 0.001 when compared to respective vehicle-treated male and female APP NLGF mice, ∧ p < 0.05 when compared to diazepam-treated male APP NLGF mice. Three-way ANOVA followed by Tukey's post hoc analysis.

Journal: Current Research in Neurobiology

Article Title: Sex-dependent sensitivity to positive allosteric modulation of GABA action in an APP knock-in mouse model of Alzheimer's disease: Potential epigenetic regulation

doi: 10.1016/j.crneur.2021.100025

Figure Lengend Snippet: Male APP NLGF mice exhibit greater sensitivity to diazepam-induced impairment of locomotor activity than female APP NLGF and wildtype (WT) mice in the open field test. Both male and female APP NLGF mice show significantly higher basal locomotor activity than their WT counterparts. While only 3 mg/kg of diazepam elicited significant suppression of locomotor activity in WT mice, 1 mg/kg of diazepam significantly suppressed locomotor activity in male and female APP NLGF mice, whereas only male APP NLGF mice were showed significant suppression of locomotor activity at 0.2 mg/kg of diazepam, suggesting that the male APP NLGF mice are more sensitivity to diazepam-induced impairment of locomotor activity than female APP NLGF and WT mice. Data represent mean ± SEM of 7 mice per group. ***p < 0.001 when compared to respective vehicle-treated male and female WT mice, # p < 0.05 and ### p < 0.001 when compared to respective vehicle-treated male and female APP NLGF mice, ∧ p < 0.05 when compared to diazepam-treated male APP NLGF mice. Three-way ANOVA followed by Tukey's post hoc analysis.

Article Snippet: Membranes were blocked using 5% milk and probed by overnight incubation at 4 °C with specific primary antibodies against α1 (1:200; 12410-1-AP, Proteintech) and α5 (1:500; NB300-195, Novus) GABA A receptor subunits, respectively.

Techniques: Activity Assay

mRNA and protein levels of α1 and α5 GABA A receptor subunits in hippocampus of APP NLGF mice. Relative mRNA quantification of α1 ( A ) and α5 ( B ) GABA A receptor subunit mRNA in adult mice hippocampus shows that the expression of the α1 GABA A receptor subunit was significantly lower in female than in male APP NLGF mice. Protein levels of α1 ( C ) and α5 ( D ) GABA A receptor subunits in adult mice hippocampus show significantly higher expression of the α1 and α5 subunit in male than in female APP NLGF mice. Upper panels above the respective graphical representation are representative Western blots for the respective GABA A receptor subunit proteins and β-actin. GABA A receptor subunit mRNA levels are expressed as 2 ΔCt while protein levels are expressed in percentage; the average of the respective WT mice considered as 100%. Data represent mean ± SEM of 8 mice per group. *p < 0.05 when compared to respective male and female WT mice, # p < 0.001 when compared to male APP NLGF mice. Two-way ANOVA followed by Tukey's post hoc.

Journal: Current Research in Neurobiology

Article Title: Sex-dependent sensitivity to positive allosteric modulation of GABA action in an APP knock-in mouse model of Alzheimer's disease: Potential epigenetic regulation

doi: 10.1016/j.crneur.2021.100025

Figure Lengend Snippet: mRNA and protein levels of α1 and α5 GABA A receptor subunits in hippocampus of APP NLGF mice. Relative mRNA quantification of α1 ( A ) and α5 ( B ) GABA A receptor subunit mRNA in adult mice hippocampus shows that the expression of the α1 GABA A receptor subunit was significantly lower in female than in male APP NLGF mice. Protein levels of α1 ( C ) and α5 ( D ) GABA A receptor subunits in adult mice hippocampus show significantly higher expression of the α1 and α5 subunit in male than in female APP NLGF mice. Upper panels above the respective graphical representation are representative Western blots for the respective GABA A receptor subunit proteins and β-actin. GABA A receptor subunit mRNA levels are expressed as 2 ΔCt while protein levels are expressed in percentage; the average of the respective WT mice considered as 100%. Data represent mean ± SEM of 8 mice per group. *p < 0.05 when compared to respective male and female WT mice, # p < 0.001 when compared to male APP NLGF mice. Two-way ANOVA followed by Tukey's post hoc.

Article Snippet: Membranes were blocked using 5% milk and probed by overnight incubation at 4 °C with specific primary antibodies against α1 (1:200; 12410-1-AP, Proteintech) and α5 (1:500; NB300-195, Novus) GABA A receptor subunits, respectively.

Techniques: Expressing, Western Blot

The occupancy of H3K4me3 but not acetylated-H3 epigenetic histone mark at Gabra1 and Gabra5 promoters regulate α1 and α5 GABA A receptor subunit transcript levels in hippocampus of male APP NLGF mice. ( A, B, C, & D ) Chromatin immunoprecipitation (ChIP) analysis for the occupancy of acetylated-H3 at two sites of Gabra1 ( A & B ) and Gabra5 ( C & D ) promoters was not significantly different in wildtype (WT) and APP NLGF mice. ( E, F, G, & H ) ChIP analysis of H3K4me3 at two sites of Gabra1 ( E & F ) and Gabra5 ( G & H ) show that H3K4me3 occupancy at both Gabra1 and Gabra5 promoters was significantly higher in male than in female APP NLGF mice. Data represent mean ± SEM of 8 mice per group. *p < 0.05 and ***p < 0.001 when compared to respective male and female WT mice, # p < 0.05 and ### p < 0.001 when compared to male APP NLGF mice. Two-way ANOVA followed by Tukey's post hoc.

Journal: Current Research in Neurobiology

Article Title: Sex-dependent sensitivity to positive allosteric modulation of GABA action in an APP knock-in mouse model of Alzheimer's disease: Potential epigenetic regulation

doi: 10.1016/j.crneur.2021.100025

Figure Lengend Snippet: The occupancy of H3K4me3 but not acetylated-H3 epigenetic histone mark at Gabra1 and Gabra5 promoters regulate α1 and α5 GABA A receptor subunit transcript levels in hippocampus of male APP NLGF mice. ( A, B, C, & D ) Chromatin immunoprecipitation (ChIP) analysis for the occupancy of acetylated-H3 at two sites of Gabra1 ( A & B ) and Gabra5 ( C & D ) promoters was not significantly different in wildtype (WT) and APP NLGF mice. ( E, F, G, & H ) ChIP analysis of H3K4me3 at two sites of Gabra1 ( E & F ) and Gabra5 ( G & H ) show that H3K4me3 occupancy at both Gabra1 and Gabra5 promoters was significantly higher in male than in female APP NLGF mice. Data represent mean ± SEM of 8 mice per group. *p < 0.05 and ***p < 0.001 when compared to respective male and female WT mice, # p < 0.05 and ### p < 0.001 when compared to male APP NLGF mice. Two-way ANOVA followed by Tukey's post hoc.

Article Snippet: Membranes were blocked using 5% milk and probed by overnight incubation at 4 °C with specific primary antibodies against α1 (1:200; 12410-1-AP, Proteintech) and α5 (1:500; NB300-195, Novus) GABA A receptor subunits, respectively.

Techniques: Chromatin Immunoprecipitation